01What We Built
Parsing Pipeline
Extracts MS level 1 spectra from .mzML files and structures the results into JSON for downstream analysis.
Interactive GUI
Guides users through file selection, chemical targeting, and graph generation with a clean PyQt5 interface.
Visualization
Provides quick plots of extracted spectra and offers export-ready views that document the experiment flow.
Individual Team Roles
- Austin decoded the binary outputs to keep plotted points accurate and paired with Daniel on GUI polish.
- Nathanael led stakeholder communication and built the parser that kicked off graph calculations.
- Emalyn transformed parser numbers into plotted graph files, ensuring calculations reflected correctly.
- Daniel crafted the upload-friendly GUI so users can generate diverse graphs through SIRIUS.
- Jason architected the early pipeline research, shaping API, SIRIUS, and MZmine exploration.
02Flowchart Evolution


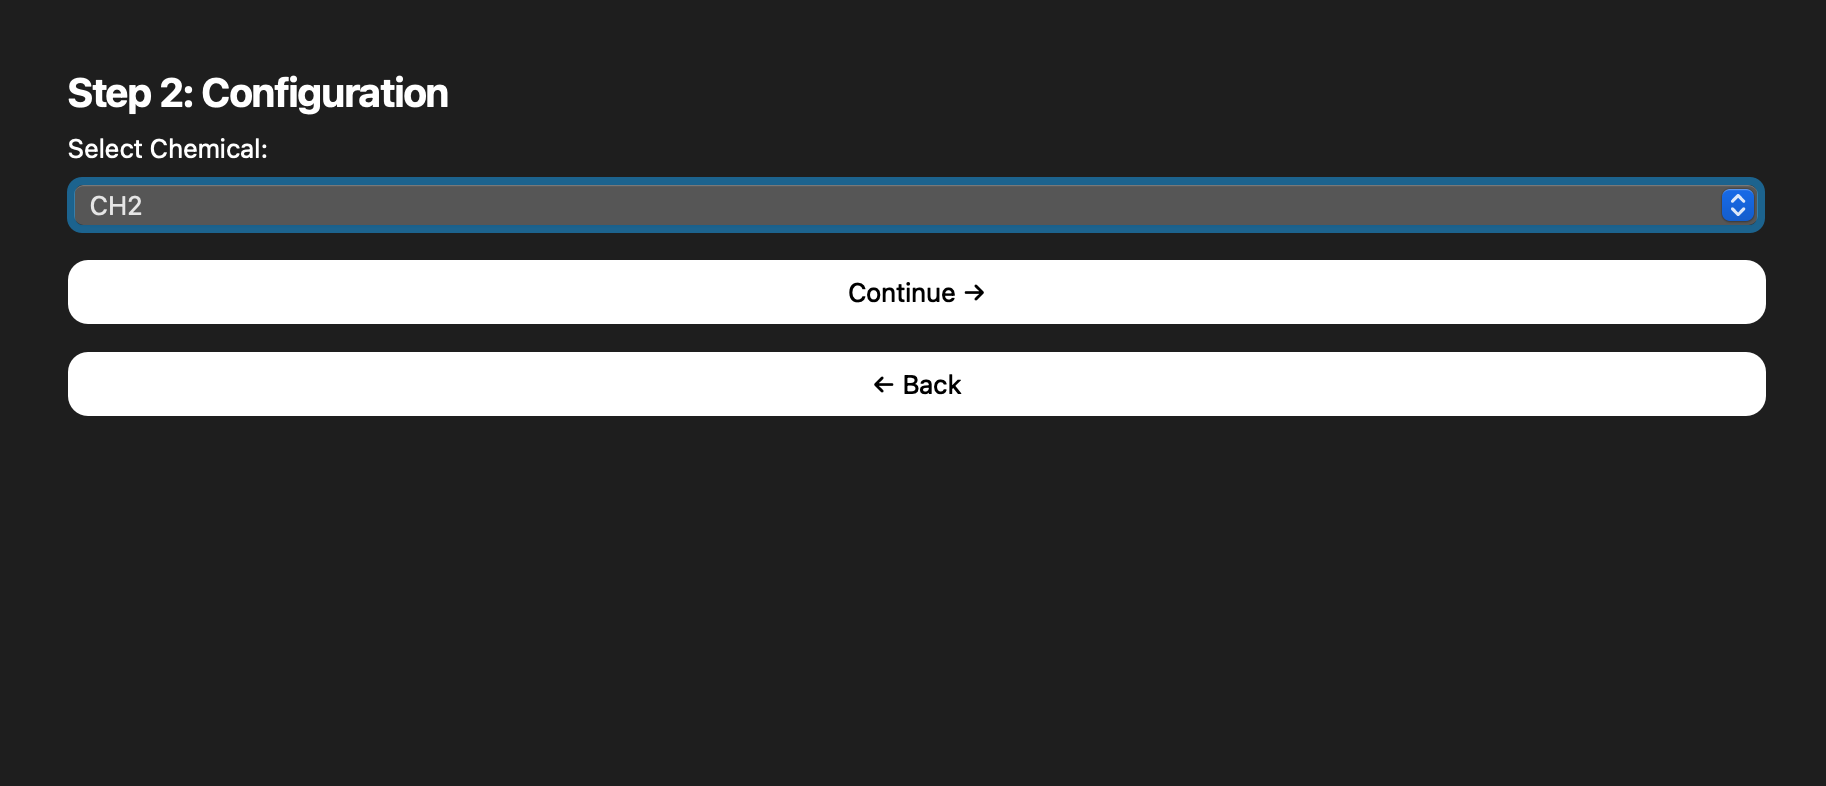
03GUI & Graph Moments
Snapshots pulled from the README capture how the interface matured from a simple loader to a guided, multi-step experience.
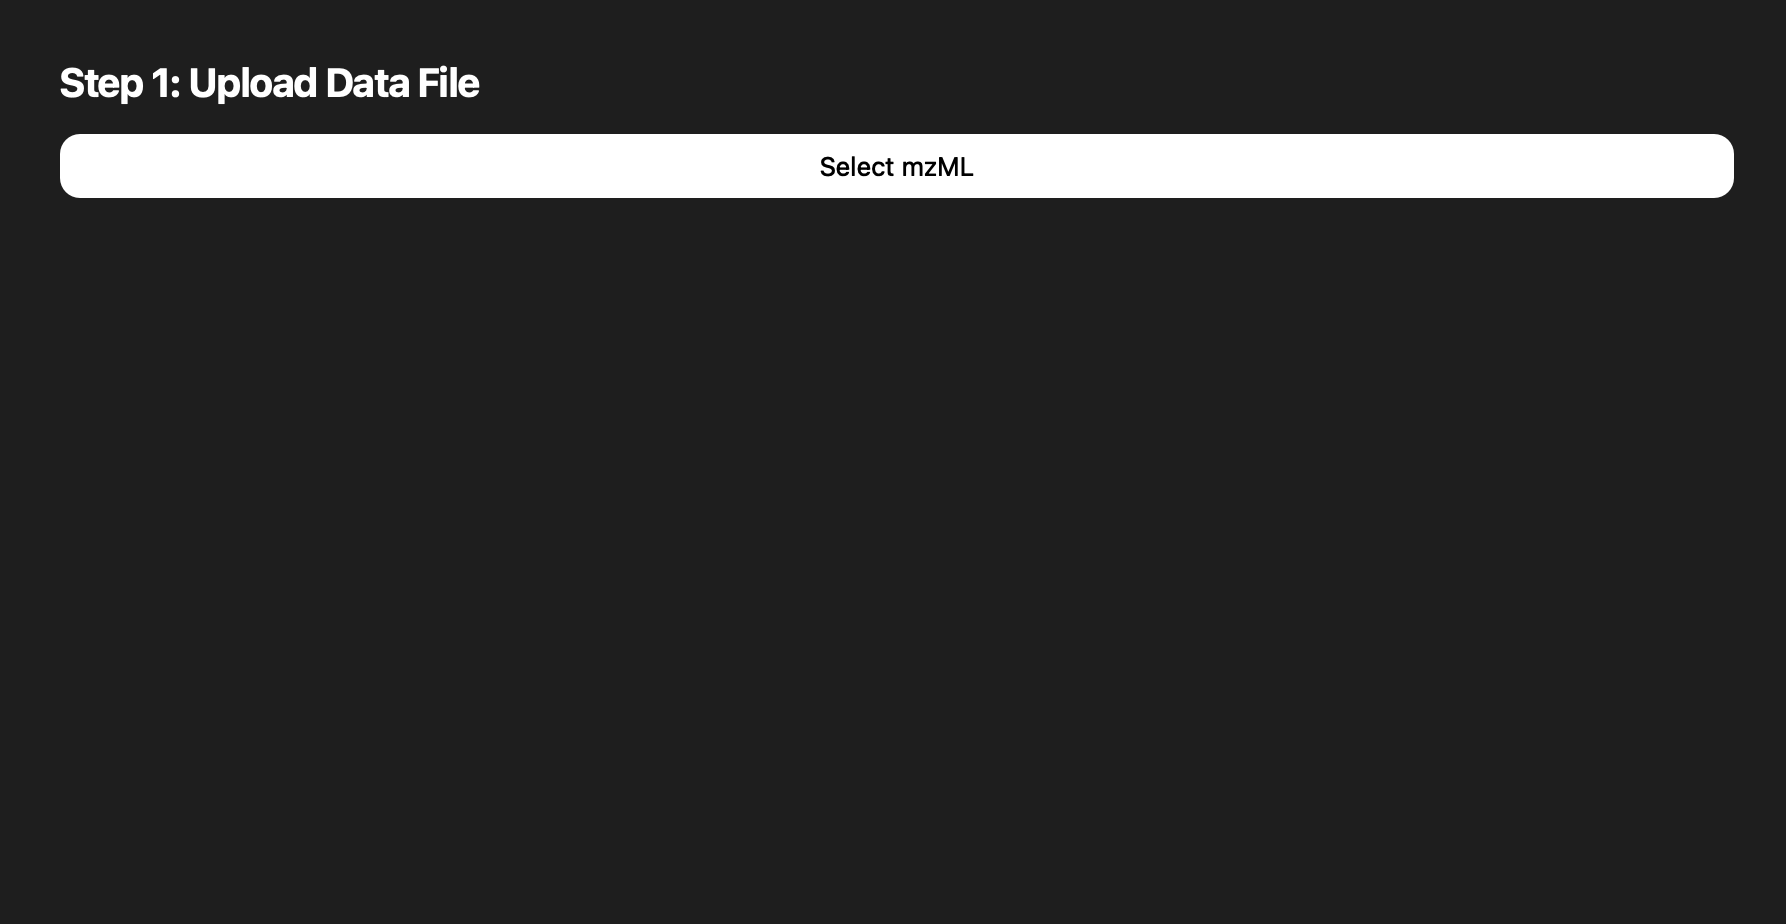
.mzML inputs.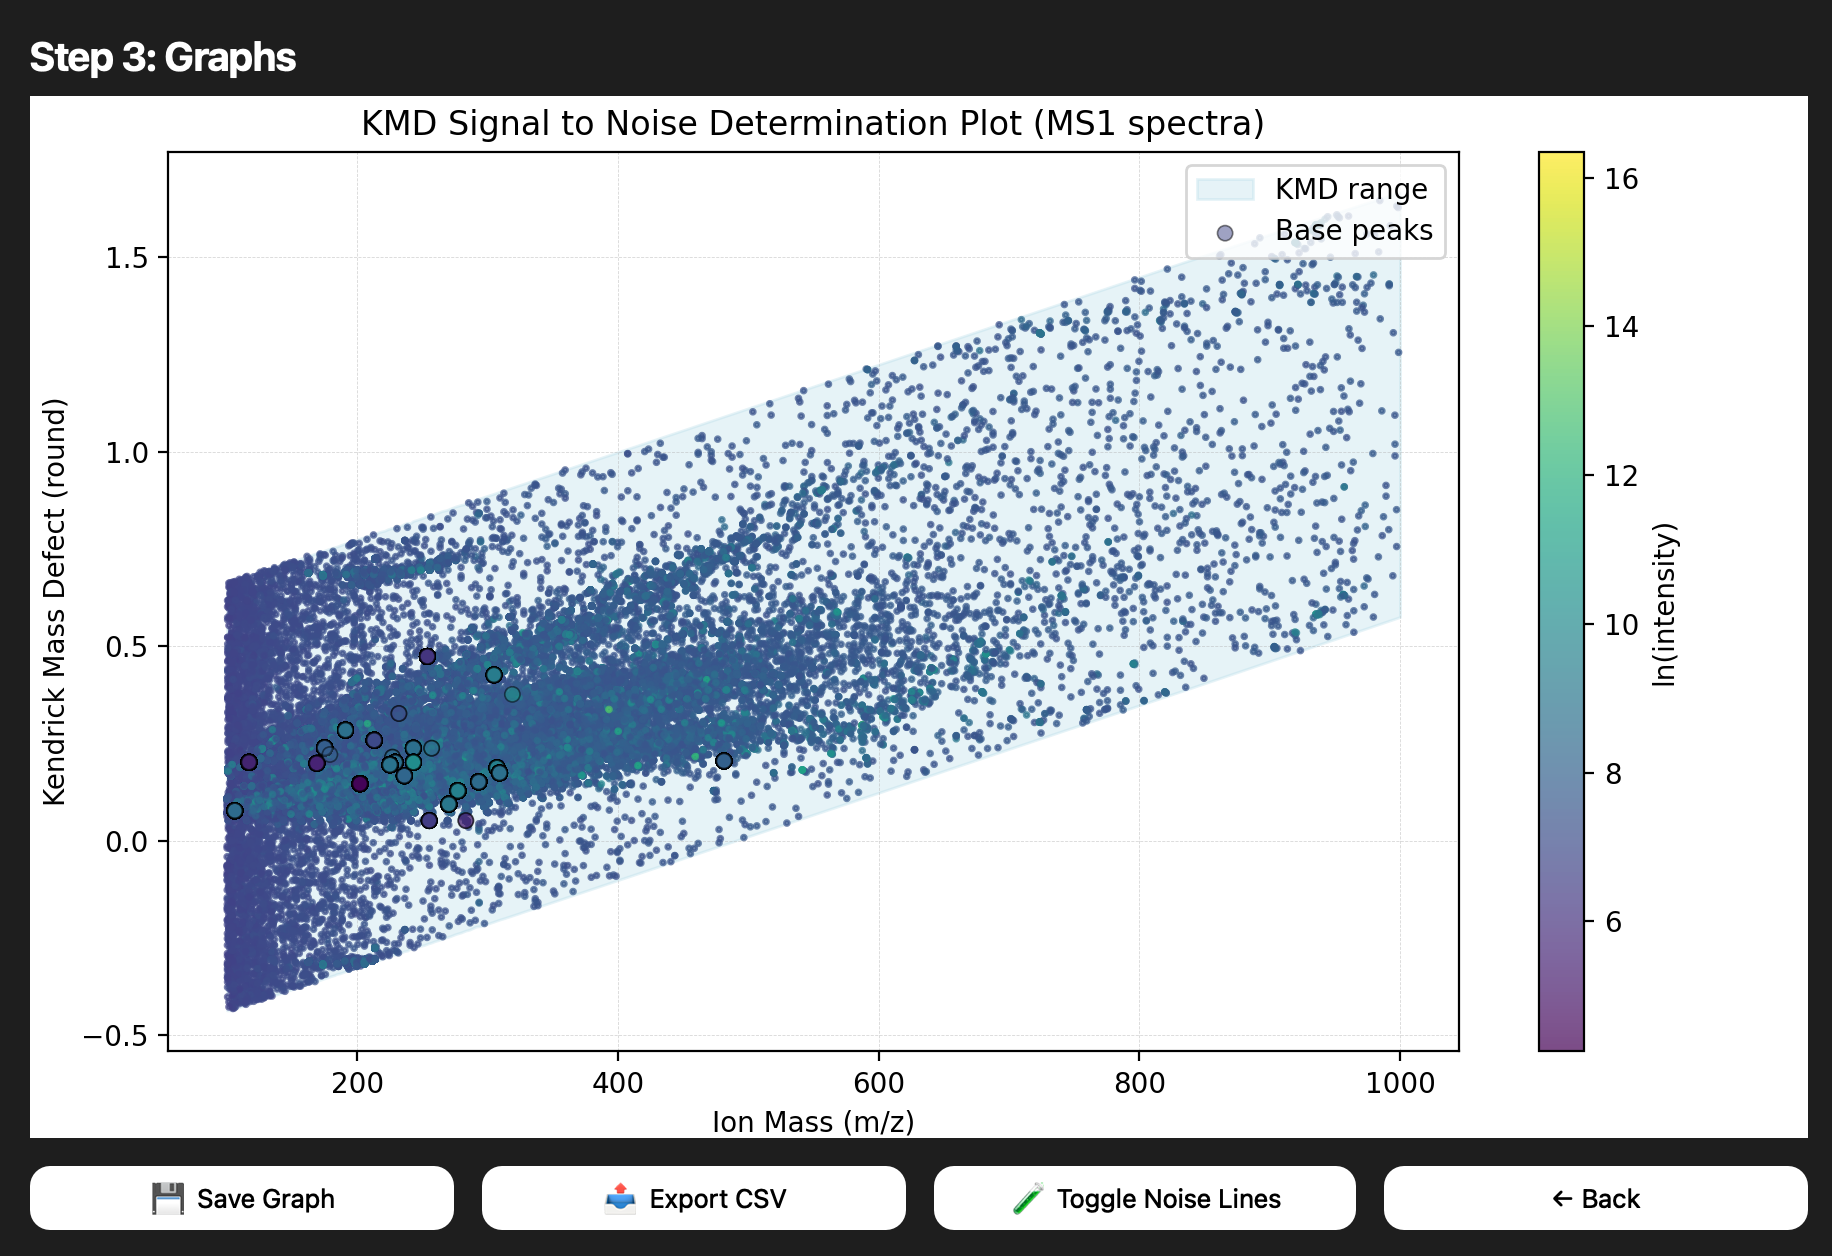
04Highlights
Data Integrity
MS level 1 filtering ensures we stay focused on the spectra that matter for quick exploratory analysis.
Speed to Insight
The GUI abstracts boilerplate steps—select a file, pick a chemical, view the plot—reducing clicks to insights.
Export-Ready
Graph outputs can be exported for reports, making it easy to share results with collaborators.
05Project Documentation
Background
The Chemical Analysis Instrumentation Lab partnered with PSL to streamline mass spectrometry analysis for water quality research.
Scope & Goals
Deliver a fast, reliable pipeline for MS1 spectra: parse .mzML, visualize KMD calculations, and keep the GUI intuitive.
Known Gaps
Only one chemical compound is currently supported and slope calculations need more validation; x-value ranges still need tuning.
Future Work
Automated moving guide lines on graphs, API integrations with tools like MZmine and SIRIUS, and expanding supported compounds.